Reveal the Unseen.

Desktop app for visualizing and analyzing measurement and simulation data for engineers.

Windows · Linux coming soon

Showcase

Fits into any workflow

Transfer data from your favorite programming language via Rest API directly into ScryLab or load your prerecorded measuerement data. Then drag & drop your data to visualize them instantly.
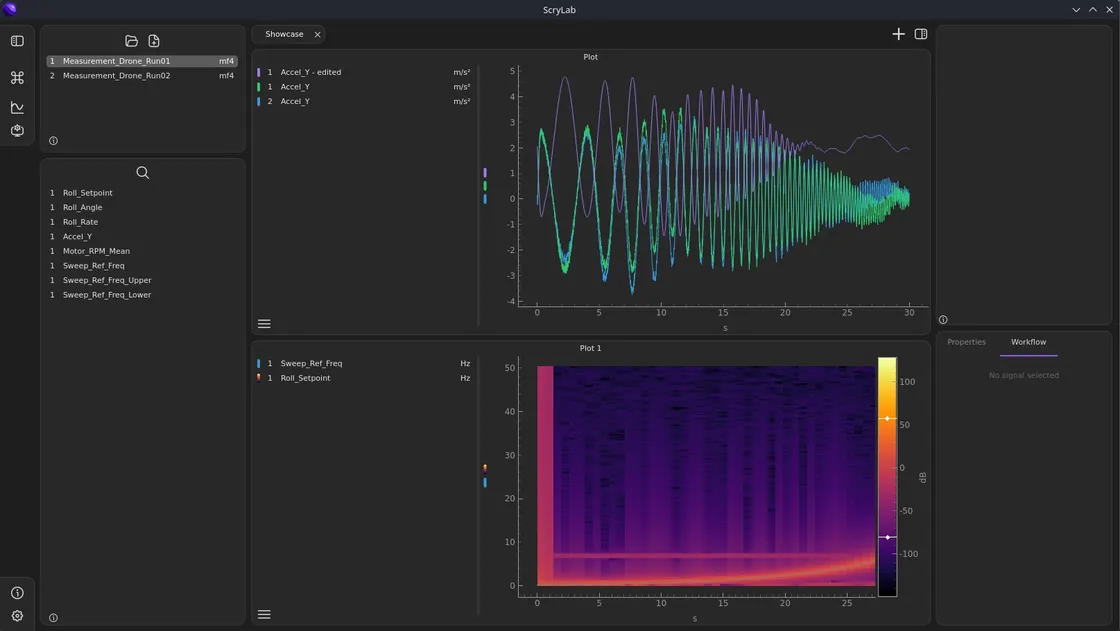
Interactive plots

In contrast to other common tools like Matplotlib or Famos, ScryLab offers you interactive and fluent plots. This enables a faster and more effective exploration of your datasets.

Easily edit your data

From simple mathematical operations like addition, derivative, integral to more complex ones like Transfer Function, STFT or Moving Averages - ScryLab offers you simple UI for all your needs.

Versatile possibilities

Compare signals

Signals from different measurement or simulation series can be visualized directly in the same plot. Simulation and measurement can be compared, order lines displayed over spectrograms, or deviations analyzed in real-time.

Compare signals

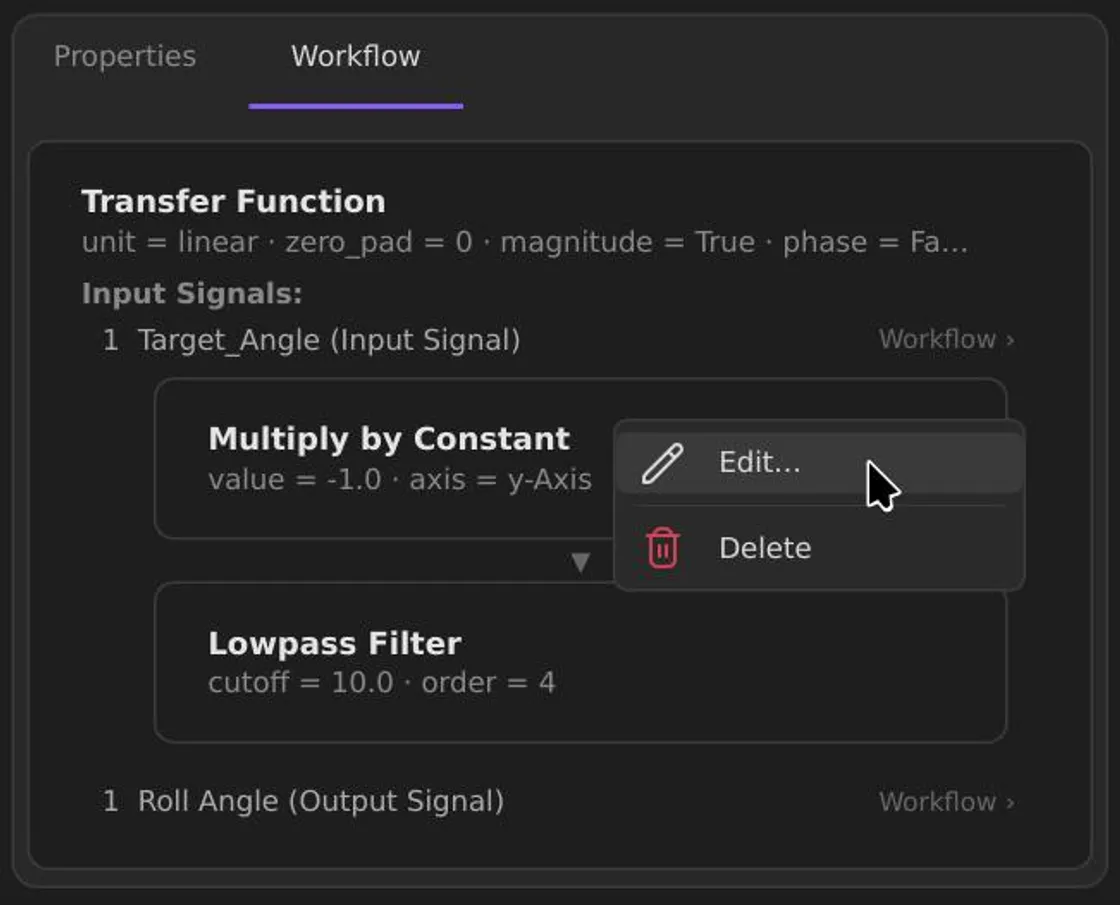
Non-destructive signal processing

Process signals further

All signal operations (e.g., addition, low-pass filter, transfer function) are stored as traceable processing steps. Each step can be moved, adjusted, or deleted afterwards.

Process signals further

FAQ

ScryLab is designed for rapid analysis and comparison of technical measurement and simulation data – particularly in the time and frequency domain up to the megahertz range. If you want to understand, manipulate, and directly compare physical signals without building your own scripting environment, this tool is well-suited. ScryLab is less suitable for extensive statistical evaluations, data science workflows, reporting, or complex database structures. The focus is clearly on interactive, signal-based analysis and gaining physical insights.
While many established programs offer very extensive feature sets and sometimes include their own scripting or automation logic, ScryLab focuses on a streamlined, direct approach. The application integrates into existing workflows and enables intuitive manipulation, comparison, and step-by-step evaluation of physical signals. Signal operations remain editable, results are immediately visible, and navigation and zooming are continuous without disruptive interaction. The goal is a simple, transparent analysis environment that supports physical understanding – not a second development platform within the existing toolchain.
The application is designed for time- and frequency-based signals in the range from approximately 1 Hz to the megahertz range. Supported types include: time series, frequency spectra, spectrograms, transfer functions, non-monotonic XY data. It is particularly suitable for high-frequency measurement and simulation data from technical systems where performance and direct comparability are crucial.
After license activation (once per year), no internet connection is required. This allows ScryLab to be used flexibly outside of a fixed workplace, for example during vehicle or aircraft testing.
ScryLab is cross-platform and runs on both Linux and Windows.
The goal of development was to make data analysis as simple and intuitive as possible. The name ScryLab combines "scrying" – an ancient method of predicting the future by observing reflections – with "Lab" for laboratory. Together, they represent the vision of making hidden insights in data visible: Reveal the Unseen.

Our plans

Plan overview

Non-commercial

For personal use and education

Free

  • All features
  • Free updates
  • Commercial use
  • Support
  • No watermark

Commercial

For professional use

Custom

  • All features
  • Free updates
  • Commercial use
  • Support
  • No watermark